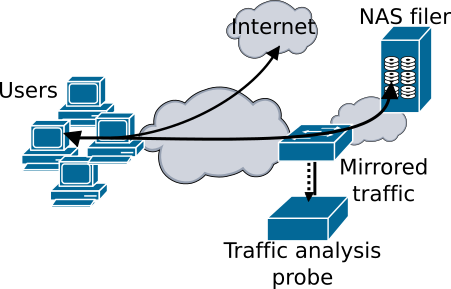
Scenario named "original"

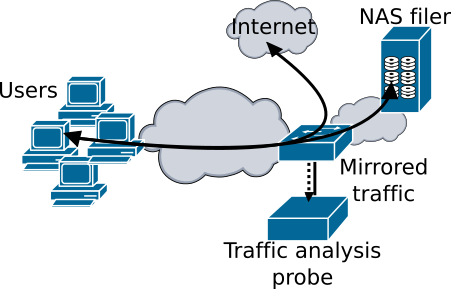
Scenario named "NAT"

To run the ransomware samples we select a scenario commonly used in enterprise networks, where user documents are centralized in file servers. All ransomware samples are run in the user's machine where the network volume is mounted. We have captured the traffic between the client and the server, containing all the file operations (open, read, write, rename, delete or close operations over the files in the shared directory).
For the same ransomware binary sometimes there are more than one traffic trace file. This is cause because we made two different scenarios (shown in the images above), in the first one only the traffic between the user and the server is captured and stored. In the second one also the traffic between the user and the internet (DNS, HTTP, etc.) is captured in order to make the repository useful for others tools that analyse this traffic.
Both user and server hosts are Windows 7 machines running virtualized in a virtualBox environment with a NAT network configuration in a host with an Intel Core 2 Duo CPU E6750 of 2.66GHz (one CPU core per virtual machine). Windows 7 uses version 2 of SMB by default for the file sharing traffic, while Windows 10 (and sometimes Windows 8) uses version 3 of SMB, which is an encrypted protocol. Some binaries were run in both a Windows 7 and a Windows 10 scenario. The scenario using Windows 10 is similar to the Windows 7 one, but the change of Operating System can result in not only different version of SMB protocol but also other differences in the TCP/IP stack implementation.
An important advantage of running the ransomware samples in a network scenario is the possibility of modifying the network speed. This could be used for simulating a slow ransomware encryption of files or a slow disk. Running the ransomware samples locally, the speed of the encryption is totally determined by the machine in which the samples were run. We offer samples where the network speed was changed from 10 to 100Mb/s in order to simulate these slower ransomwares.
Finally, the content of the shared directory can be important for some tools that focus their detection in the number of files, accesses or directories. Therefore, some samples were run with more than one different shared directory.
Information about the I/O operations file
These files have been extracted from the traffic traces files by a specific software. The objective of this extraction is to make the repository useful for testing the tools that focus their detection in the analysis of I/O operations locally. The file generated has one line for each request or response seen in the trace. The first line gives the information about what each column is. For the rest of the lines in the file, each column has this information: (See here information about the SMB protocol)
1. Timestamp of the request/response
2. Client IP
3. Server IP
4. Client TCP port
5. Server TCP port
6. Command SMB
7. Subcommand SMB
8. Message ID
9. Request/response flag
10. Status of the response (in Responses)
11. TreeID
12. SessionID
13. FileID (in Requests)
14. Open permissions (in Create Responses)
15. File size (in Create Responses)
16. File name (in Create Requests)
17. Data offset (in Read and Write Requests and Responses)
18. Data length (in Read and Write Requests and Responses)
19. New file name (in Rename Requests)
Information about the DNS and TCP connections
We have divided the DNS and TCP connections information in two separated files, as some tools based their detection only on one of these characteristics. The file containing the DNS requests and responses information is called 'DNSinfo' and the file with the TCP connections information is called 'TCPconnInfo'. Both are in text format, with the fields of each line separated by a white space. Each line corresponds to one DNS request-response and one TCP connection. These files are available only for the ransomware samples run in the NAT scenario, as in the others the traffic to the public internet was not captured.
DNS info file
This file provides information about the DNS requests and respones. It can be useful for analysing the C&C domains used by ransomwares. It is important to note that some ransomwares do not require any contact with servers, as they can be executed offline. In these cases, the file will only contain the DNS requests and responses that the Operative System makes ‘by default’.
Each line has the following columns:
1. Timestamp of the DNS request
2. IP and port of the client (in this case the infected machine). The IP and port are separated by “:”
3. IP and port of the DNS server (in this case the by default DNS server is 8.8.8.8). The IP and prot are separated by “:”
4. RCode of the DNS response. This is the code sent by the server that indicates if it has been able to resolve the request or not. This field can have different values but the most common are 0 (success) and 3 (hostname not found)
5. Request. It is a string with the Name, type and class of the request separated by commas. If there are more than one request in the packet, the requests are separated by “;”. The most common types of request seen in the repository are “A”, and “AAAA”
6. Response. It is a string with the IP, type and class of the request separated by commas. As in the previous field, if there are more than one response in the packet, the requests are separated by “;”
TCP connections info file
This file contains information about the TCP connection that the infected machine establishes with machines of external networks (this means, the connections with the NAS server are not in this file).
It has 12 columns separated by white spaces. When the TCP connection has HTTP traffic, the three last columns presents the HTTP method, the response code and the URL requested. In case the connection has other protocol, these fields are setted to “(null)”. Each line has the following columns:
1. IP and port of the client (the infected machine). The IP and port are separated by “:”
2. IP and port of the server. The IP and port are separated by “:”
3. Bytes sent from the client to the server
4. Bytes sent from the server to the client
5. RSTs in the TCP connection (from client to server)
6. RSTs in the TCP connection (from server to client)
7. FINs in the TCP connection (from client to server)
8. FINs in the TCP connection (from server to client)
9. Number of HTTP requests present in the connection
10. HTTP method (GET or POST) of the HTTP requests. (In case of the connection have not got HTTP traffic, the field is set to null)
11. Response code to the HTTP requests. (null if there is not HTTP traffic)
12. URL requested in the HTTP request. (null if there is not HTTP traffic)